(Logiciel informatique) pf BSD
fw vous permet de consulter les graphes du pare-feu à chaque instant.
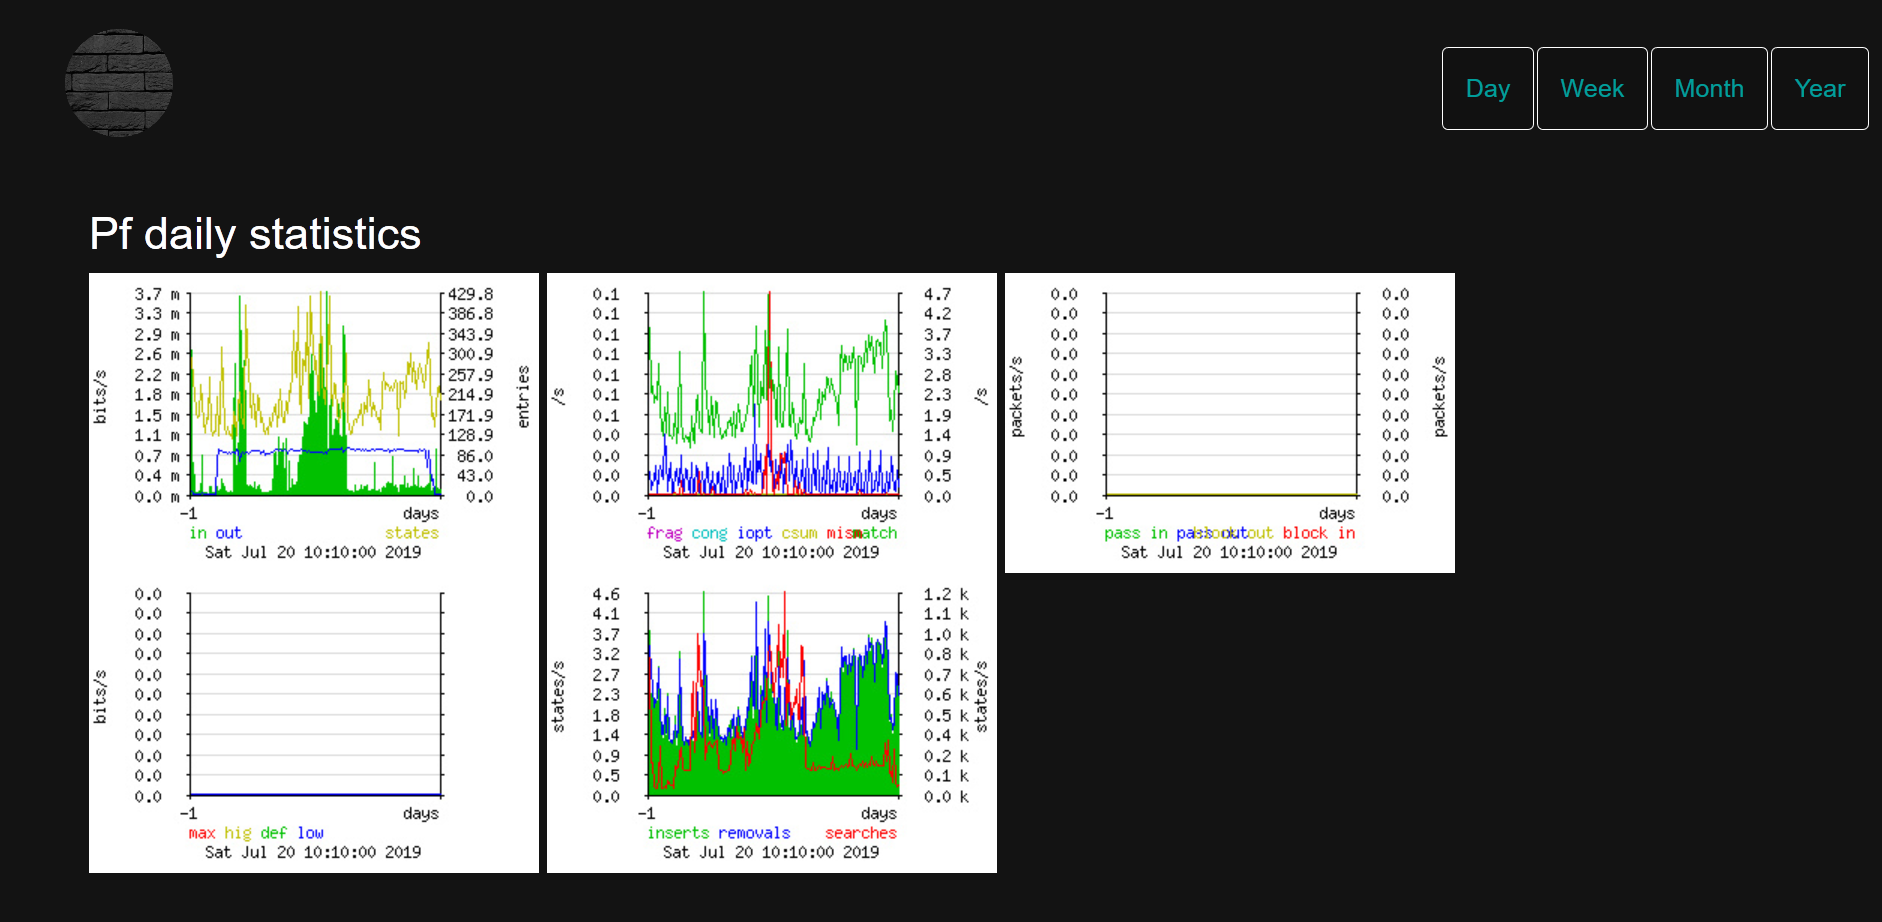
Composant distribué par AURORÆ Solutions, basé sur pf + pfstat, voir [1], [2] et [3].
Ce document a été publié le 2018-06-28 14:25:35. (Dernière mise à jour : 2024-05-15 10:06:07.)